
Suggestions
No matching terms.
Brew Control Chart
Also known as BCC · SCA brew chart · carta de control de brew · control chart
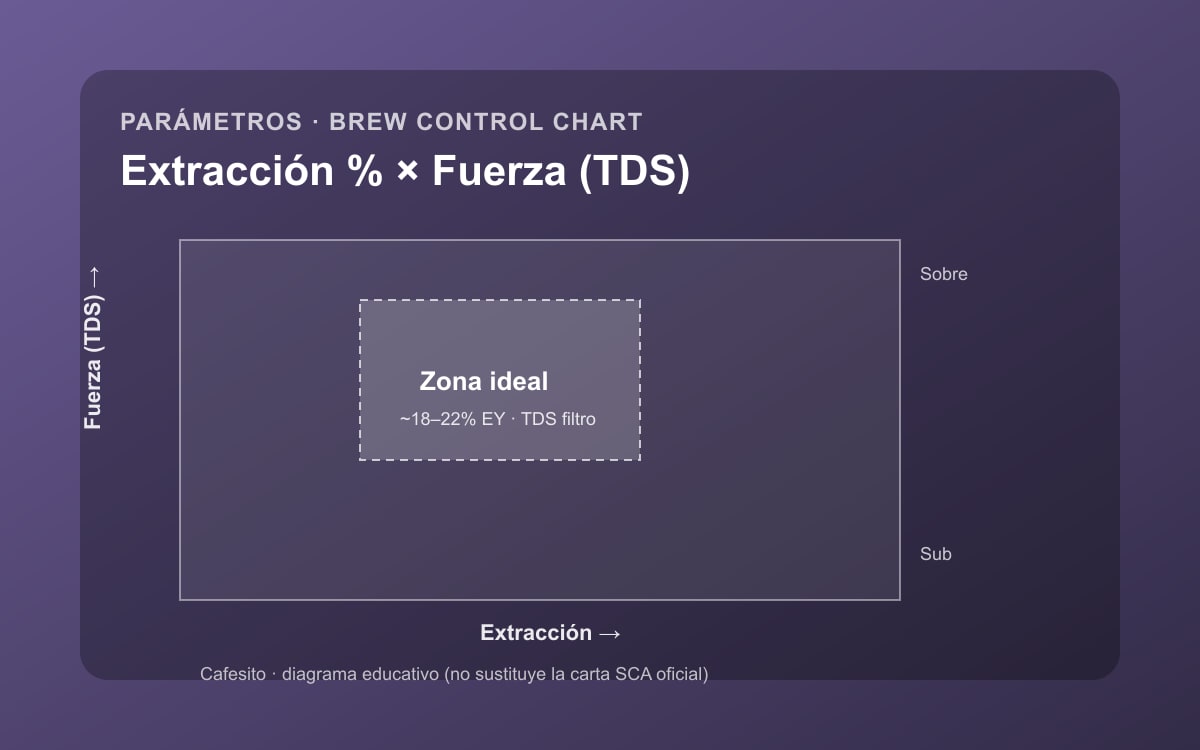
What it is and what sets it apart: The chart links beverage concentration to percent solids extracted from the coffee—not a meter, but the frame for readings and tasting.
How it’s used or measured: Measure TDS → compute EY% from dose and yield → plot. Cross-check with taste. Log TDS/EY in Brew Lab even without plotting.
Flavours and cup impact: Historic filter “ideal” ~1.15–1.45% TDS and ~18–22% EY (guide). Benefit: shared language.
Technical notes: Espresso uses different bands. Chart ≠ taste; calibrate the refractometer.
Common mistakes: Chasing the box while ignoring flavour. Applying filter bands to espresso blindly.
In Cafesito
Save coffees to your pantry, brew with method and keep your diary.